It had been a month since i land my fingers on the keyboard to write a post. Lately had been busy. The market going sideway, absolutely directionless... This is the month of February whereby a lot of companies are announcing their Q4 results. And we will be expecting a lot of annual reports in the month of April. I actually had been waiting for a few companies to release the Q result. One of it is LIIHEN[1]. But before i further into LIIHEN, let me just talk on a few things.
 |
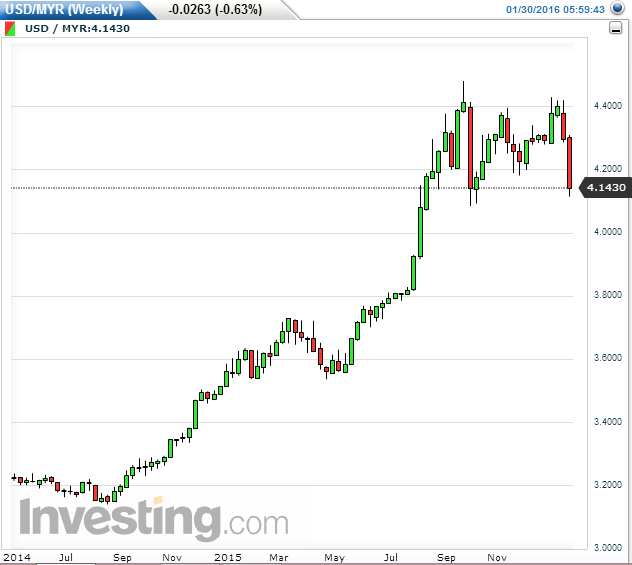
| USD/MYR monthly chart |
First is the USD/MYR. Our Ringgit is getting stronger alongside with the recovering Brent Crude Oil. Above is the monthly chart of the USD/MYR. Monthly chart usually precedes the weekly chart and also daily chart, providing a better forecast. From the chart, we can saw a descending triangle, which signifies that it is actually a downtrend. Next is the Brent Crude Oil monthly chart. Two hammers seen, signifying that the oil might be rebounding. Well, these are my observations. It needed to be equipped with the fundamental news. With the Saudi and Russia to freeze the oil production, which might bring some impact to the oil price. We will need to be keen of the global news. For me, oil price might rebound with the potential strengthening Ringgit.
 |
| Brent Crude Oil Monthly Chart |
Now, lets come back to our highlight of the post, LIIHEN.
1. Fundamental Analysis:
 |
| LIIHEN Q4 2015 Result [2] |
LIIHEN announces their Last Quarter Result on 24 February 2016. By comparing the same quarters, LIIHEN registered a triple digit growth in net profit, 143.17% while the revenue increased 47.81% due to the increase in sales. The breakdown of the 47% is 30% of forex exchange (3.29 vs 4.27) while another 15% is contributed by the sales[2]. When we are comparing the Q3 and Q4, the revenue and net profit increased 6% and 18% respectively, mainly because of the MYR strengthening (4.02 vs 4.27). One point when i am analyzing its balance sheet, its intangible assets had decreased from RM4,813k to RM541k due to the use of 3,473 hectares of permanent reserve forest land for planting and cultivation of rubber wood trees.
 |
| Revenue and Net Profit from 2011 to 2015 |
By observing from 2011 to 2015, the revenue and net profit had been increasing consistently. The net profit margin for 2015 is 10.46%, averaging around 6.65% from 2011 to 2015. LIIHEN is still a net cash company with RM89,715k, with RM0.4984 net cash per share. In the current year prospect, the management mentioned that the main challenges for 2016 are local issues, such as acceleration of production costs and shortages of workforce. In view of that, the management will focus on three solutions, first, continue to diversify product range to strengthen the market position, second to expand the customer base and third to continue to adopt effective cost management. With better controllable cost structure and wider sales market base, the management is committed to deliver a favourable result for year 2016.